The Income Strategy: Structure, Benefits and a Live Test on 29 October

The Income strategy backs broadly diversified, high-distribution companies rather than the largest names in the index. Here we show how the building block is structured, what benefits this structure brings and where its limits lie. A current example is 29 October, when the structure worked well, above all in North America.
How the block works
The Income North America block currently holds 34 stocks from the USA and Canada. A scoring model rates each stock monthly. Dividend yield and dividend growth carry heavy weight, complemented by momentum. Sector bands prevent any single sector from dominating the portfolio.
A stock’s weight does not depend on its market capitalisation. This removes the mechanism that concentrates capitalisation-weighted indices ever more heavily in a few large corporations. In the S&P 500, the ten largest stocks make up more than a third of the index (ETF Central); in the Income block, no position exceeds 4.5 percent.
The result is a portfolio focused on healthcare, consumer staples, financials and energy, that is, on business models with predictable cash flows. Technology is represented, but through established dividend payers such as IBM and Qualcomm, not through the large growth stocks.
Less volatility, smaller setbacks
Dividend strategies typically fluctuate less than the overall market and lose less in corrections. There are three structural reasons for this.
- Stable business models. A company that pays and raises dividends for years needs predictable cash flows. The earnings of pharma, consumer staples or utilities depend less on the economic cycle and technology cycles.
- A shorter way to fall. Dividend stocks are usually valued lower than growth stocks. Part of the return arrives as an ongoing distribution, not as an expectation about the distant future. When expectations are disappointed, the price falls less far.
- Cash instead of investment promises. On 29 October, Alphabet was punished mainly for negative free cash flow alongside rising investment plans (Current Logic). Dividend payers stand on the other side of this debate: they return cash to shareholders.
The long-term data on the S&P 500 Dividend Aristocrats Index support this. From 2005 to March 2023, upside capture was 91 percent and downside capture 80 percent. In 2022 the index beat the S&P 500 by around 12 percentage points, and in eight of the ten weakest quarters since 2005 it performed better (ProShares via ETF.com). In phases with a VIX above 20, too, it was clearly ahead on average (S&P DJI Indexology).
The Everon block is not identical to this index, but follows the same logic: quality of the distribution before size of the company.
The structure by example: 29 October
On 29 October, Alphabet fell by almost 13 percent after its quarterly results. The S&P 500 lost 0.3 percent, the Nasdaq 1.4 percent. The Income North America block closed the day at +1.5 percent. 33 of the 34 stocks were in positive territory, led by consumer and pharma names such as Altria, Philip Morris and Merck. Healthcare stocks rose sharply and at times reached a record high (StockTitan).
The result did not come from a single hit but from breadth. In the S&P 500, by contrast, one stock was enough to turn the index negative even though most stocks rose: the equal-weighted version of the index gained 1.2 percent on the same day (Saxo). The structure is designed for exactly such market phases.
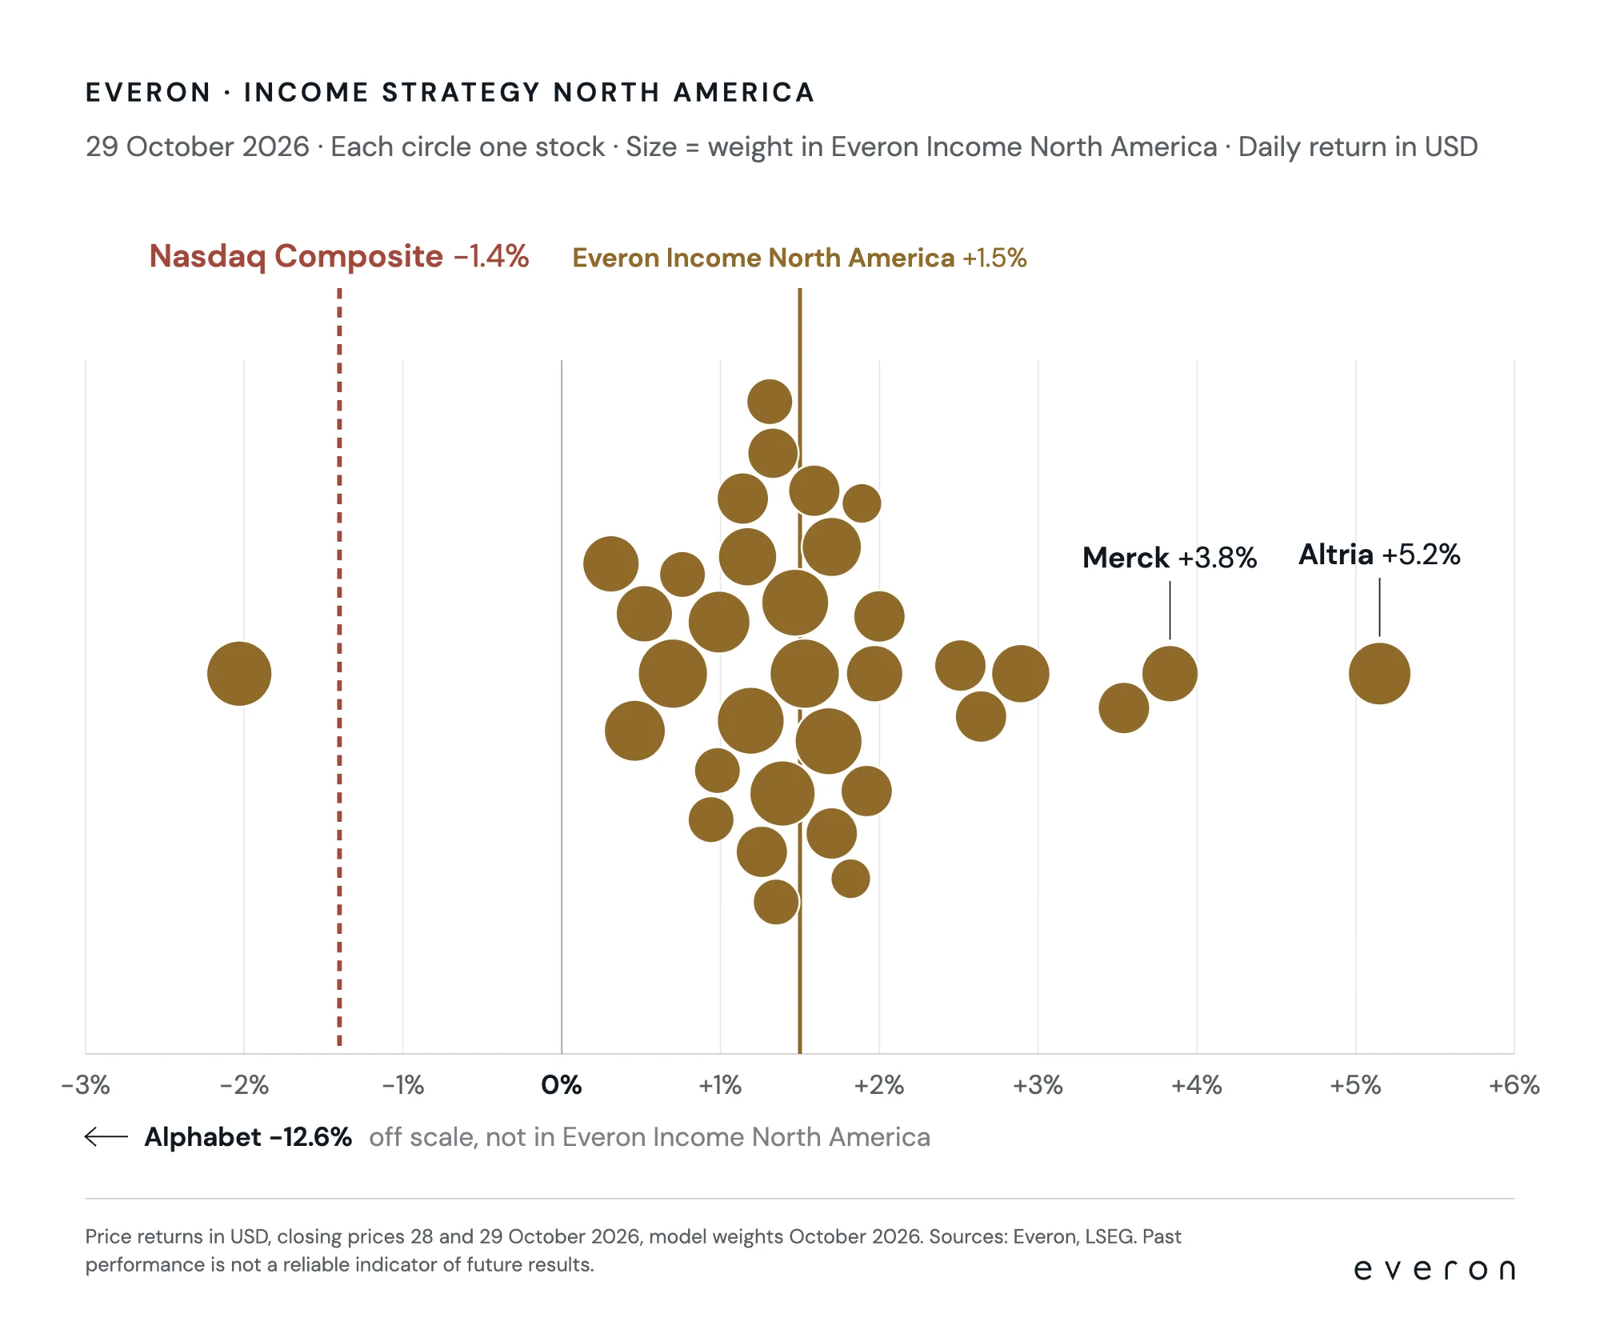 Chart: Daily returns of the individual stocks in the Income North America block on 29 October 2026. Each circle represents a stock, its area the stock’s weight. Price returns in USD, closing prices of 28 and 29 October 2026, based on model weights as of October 2026. Sources: Everon, LSEG.
Every sector in the block closed the day in positive territory. The two largest defensive sectors contributed more than half of the gain.
The price of this
A single trading day does not prove outperformance. And the same mechanism works in the other direction: when a few large technology stocks pull the market upwards, an Income strategy lags behind the S&P 500 and well behind the Nasdaq.
The long-term figures show this as well. Over ten years to the end of 2024, the Dividend Aristocrats Index returned 9.81 percent per year, the S&P 500 13.09 percent (ProShares). Anyone who wants lower volatility gives up part of the upside potential in strong tech phases.
For this reason we see the Income strategy not as a substitute for a market portfolio but as a building block alongside it. It spreads risk differently and cushions phases in which the index depends on a few names.
Conclusion
The Income North America strategy is designed for breadth, dividend quality and independence from individual large corporations. This dampens volatility and setbacks, but costs return in tech-driven rallies. 29 October was a day on which the benefits of this structure became clearly visible.
Details: Price returns 28 to 29 October 2026 in USD, excluding dividends and costs, based on model weights as of October 2026. Index and market data from third-party providers.
Sources
- The Wall Street Republic, Daily Market Recap 29 October 2026
- StockTitan, Stock Market Today 29 October 2026
- Saxo, Options Brief 30 October 2026
- Current Logic, Morning Brief 29 October 2026
- ETF Central, IVV Holdings February 2026
- ProShares via ETF.com, Why Dividend Growth Is a Timeless Strategy
- S&P DJI Indexology, Dividend Aristocrats in Challenging Markets
- ProShares, Times of Turbulence (Dec. 2024)

This article is for general information purposes only and does not constitute investment, legal or tax advice, nor an offer to buy or sell financial instruments. Everon AG is a wealth manager licensed by FINMA under FinIA. Past performance is not a reliable indicator of future returns.
The Everon strategy performance shown is historical and is stated before costs and fees.