Factor Risk Premia: Value, Momentum, Size, and Quality in Recent Years

Value, Size, Momentum and Profitability in the US equity market: what the Kenneth R. French Data Library shows for the ten years to August 2026, year by year and against the long run.
From September 2016 to August 2026, the classic factor premia delivered little in the US equity market. Size, Value and Investment were negative on an annualised basis, expressed as an average return per year, while Profitability and Momentum were narrowly positive. In the fifty-odd years before that, all five were positive.
This article presents the figures from the Kenneth R. French Data Library, factor by factor and year by year. The academic background and the way Everon uses factors in stock selection are covered in Factor Investing with Everon.
The key points at a glance
- Data basis: Kenneth R. French Data Library, US equities, monthly returns to August 2026, factors as long-short portfolios, all series before costs.
- Ten weak years: On an annualised basis, Size returned -2.5, Value -1.0, Investment -1.0, Profitability 1.9 and Momentum 1.4 percent. The market was 12.6 percent a year above the risk-free rate.
- Long run positive: From July 1963 to August 2016, all five premia ranged between 2.5 and 7.2 percent a year.
- Value: From December 2016 to September 2020 the factor lost 51 percent at its trough, and it recovered part of that in 2021 and 2022.
- Momentum: The factor fell by around a fifth in both 2016 and 2023, with strong years in between.
- Profitability: Often read as a quality factor, it was mostly positive until 2024 but clearly negative in 2025 and the first eight months of 2026.
Data basis: what the French Data Library measures
Kenneth R. French teaches at the Tuck School of Business at Dartmouth and publishes factor series on his website, updated monthly. With Eugene Fama, winner of the 2013 Nobel Memorial Prize in Economic Sciences, he developed the three-factor model with Market, Size and Value in 1993; in 2015, the two extended it with Profitability and Investment. Momentum is maintained by the library as a separate series.
The six series covered in this article:
- Market (Mkt-RF): the return on all US equities in the CRSP database, weighted by market capitalisation, less the monthly return on US Treasury bills.
- Size (SMB, small minus big): small companies against large ones.
- Value (HML, high minus low): shares with a high book-to-market ratio against shares with a low one.
- Profitability (RMW, robust minus weak): companies with high operating profitability against those with low operating profitability.
- Investment (CMA, conservative minus aggressive): companies with conservative growth in total assets against those with aggressive growth.
- Momentum (Mom): shares with high returns against shares with low returns in months 2 to 12 before portfolio formation.
Each factor is a long-short portfolio: one group is bought, the other sold short. The return therefore measures the gap between the two groups, not the return of a product. Trading costs and taxes are not included.
The library does not maintain a factor called Quality. The closest is RMW. This factor does not measure other quality characteristics such as low debt or stable earnings, which is why it is called Profitability here.
The figures are based on the August 2026 data, retrieved on 28 September 2026. The values depend on the state of the CRSP database at the time and may shift slightly with later updates.
Annual returns since 2016
Returns in percent, monthly returns compounded within the year. For 2026, this covers the months from January to August. The library also publishes its own annual figures. They are constructed differently and therefore differ, in some cases markedly: for Value in 2020, for example, -46.9 rather than -30.7 percent. This article uses the compounded monthly returns throughout, for the table, the chart, the ten-year figures and the drawdowns.
| Year | Market (excess return) | Size | Value | Profitability | Investment | Momentum |
|---|---|---|---|---|---|---|
| 2016 | 13.3 | 8.7 | 20.6 | 3.4 | 8.4 | -18.2 |
| 2017 | 21.3 | -5.2 | -10.8 | 3.8 | -9.2 | 3.8 |
| 2018 | -6.7 | -4.9 | -10.5 | -2.1 | -0.2 | 10.7 |
| 2019 | 27.9 | -4.6 | -8.1 | 3.0 | -2.9 | -5.5 |
| 2020 | 23.5 | 5.7 | -30.7 | -2.3 | -8.7 | -0.9 |
| 2021 | 23.9 | -1.5 | 22.2 | 24.5 | 10.0 | -2.9 |
| 2022 | -21.0 | -1.4 | 31.7 | 8.4 | 29.1 | 20.2 |
| 2023 | 20.8 | -3.9 | -11.1 | 3.8 | -16.1 | -20.5 |
| 2024 | 18.9 | -10.5 | -7.0 | 4.1 | -8.4 | 18.5 |
| 2025 | 12.8 | -7.8 | 6.6 | -10.2 | -4.9 | -2.2 |
| 2026 (Jan to Aug) | 10.1 | 6.1 | 8.3 | -9.6 | 5.0 | 3.9 |
Source: Kenneth R. French Data Library, data to August 2026. Own calculations.
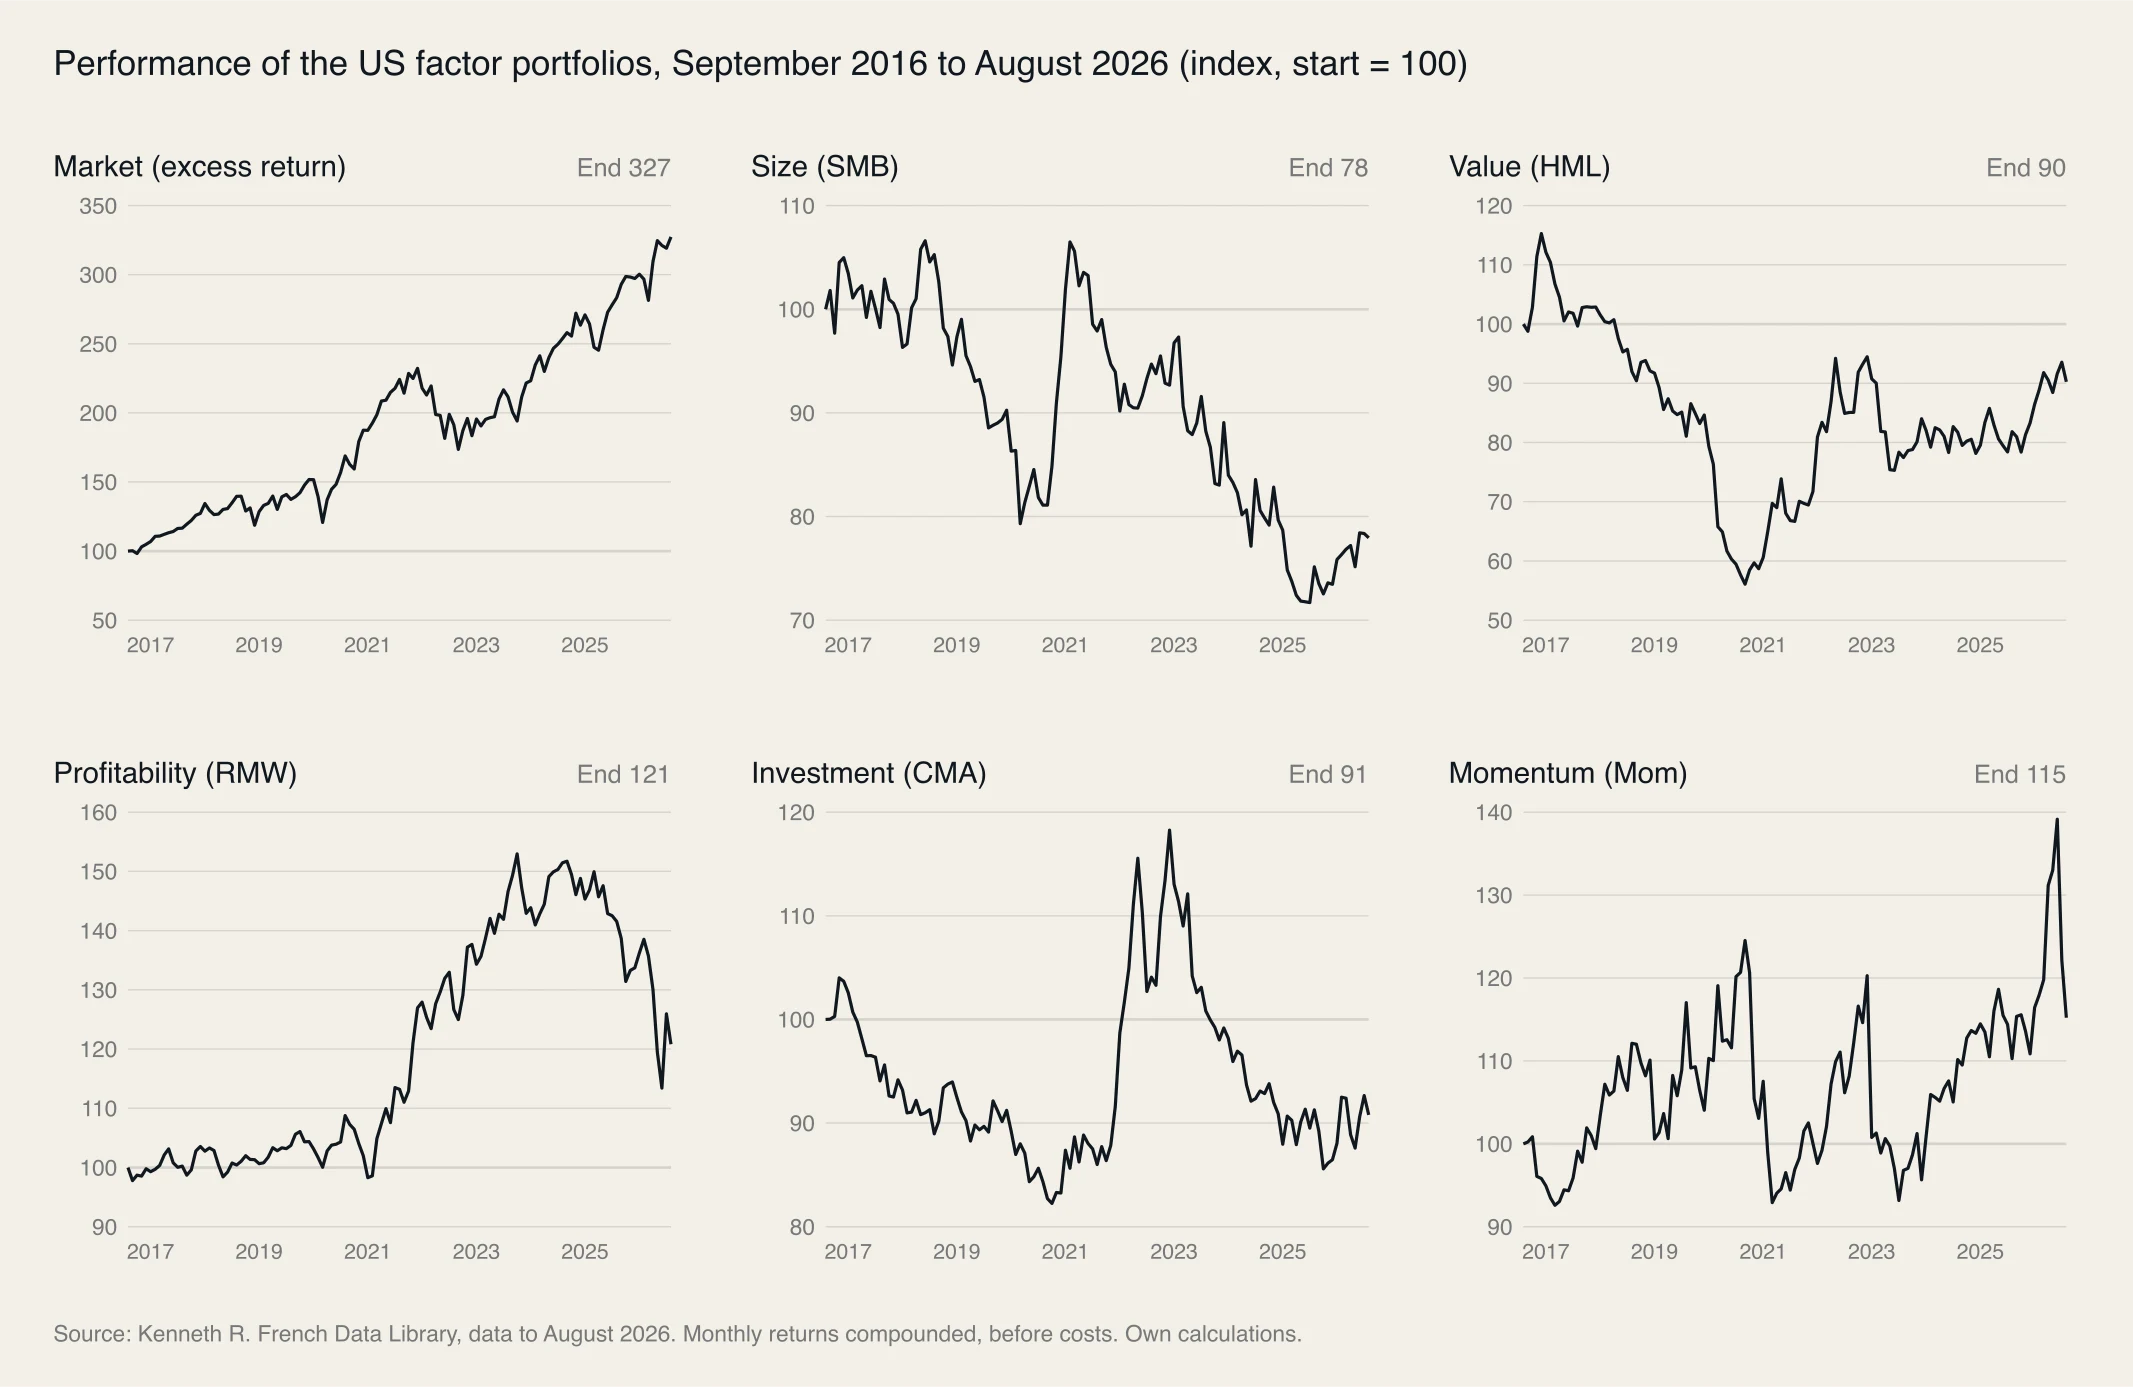
The chart compounds each factor’s monthly returns from September 2016 into an index starting at 100. At the end of August 2026, the market stood at 327, Profitability at 121, Momentum at 115, Investment at 91, Value at 90 and Size at 78.
Ten years against the long run
Annualised returns in percent, compounded from monthly returns. Volatility is the annualised standard deviation of monthly returns from September 2016 to August 2026.
| Factor | July 1963 to August 2016 | September 2016 to August 2026 | Volatility 2016 to 2026 |
|---|---|---|---|
| Market (excess return) | 5.0 | 12.6 | 15.9 |
| Size | 2.5 | -2.5 | 10.4 |
| Value | 3.8 | -1.0 | 13.5 |
| Profitability | 2.9 | 1.9 | 9.0 |
| Investment | 3.4 | -1.0 | 8.7 |
| Momentum | 7.2 | 1.4 | 14.0 |
Source: Kenneth R. French Data Library, data to August 2026. Own calculations.
The gap is large, and the data alone cannot explain where it comes from. It is possible that the premia have shrunk since they became known and widely used. It is also possible that ten years is simply too short a period: with volatility between just under 9 and 14 percent a year, none of the five ten-year averages is statistically distinguishable from zero, neither positive nor negative.
Value: a deep trough, then a choppy recovery
Value lost 51 percent at its trough from December 2016 to September 2020, with 30.7 percent in 2020 alone. 2021 and 2022 followed with 22.2 and 31.7 percent. The second of these years was one in which the market lay 21.0 percent below the risk-free rate. How that year unfolded in the markets is described in Market review 2022 and outlook 2023.
2023 and 2024 were negative, 2025 and the first eight months of 2026 positive. At the end of August 2026, the Value index stood around 10 percent below its September 2016 level.
Momentum: strong years, abrupt drawdowns
Momentum delivered double-digit returns in 2018, 2022 and 2024, and lost around a fifth in both 2016 and 2023. The largest decline within the ten years was 25.4 percent, from September 2020 to March 2021. 2026 shows the same pattern: the factor rose markedly until June, then lost 12.2 and 5.7 percent in July and August.
Such drawdowns occur above all in phases when the market turns abruptly after a decline and the previously weak stocks rebound the most (Daniel and Moskowitz, 2016). On the mechanics of the factor: Momentum as a return factor: the systematics behind relative strength.
Size: negative in eight of ten years
Small companies were ahead of large ones in only two of the ten years from 2016 to 2025: 2016 and 2020. The largest decline within the ten years was 32.7 percent, from June 2018 to July 2025. In 2026, Size is up 6.1 percent to the end of August. Over the ten years, that comes to -2.5 percent annualised, down from 2.5 percent a year from 1963 to 2016.
Profitability: calm for a long time, sharply negative of late
From 2016 to 2024, Profitability was positive in seven of nine years, most strongly in 2021 at 24.5 percent. 2025 followed with -10.2 percent and a further -9.6 percent from January to August 2026. From October 2023 to June 2026, the factor lost 25.9 percent. In 2026, it has also swung sharply from month to month: -8.2 percent in May, 11.1 percent in July.
The picture of a calm factor suggested by the years to 2024 does not hold for the last twenty months.
Investment: closely tied to Value
Over the ten years, Investment largely tracked Value, with the correlation of monthly returns at 0.64. The strongest year was 2022 with 29.1 percent, the weakest 2023 with -16.1 percent. At the end of August 2026, the index stood 9 percent below its starting value.
Correlations between the factors
Correlation of monthly returns from September 2016 to August 2026.
| Market | Size | Value | Profitability | Investment | Momentum | |
|---|---|---|---|---|---|---|
| Market | 1 | 0.30 | -0.02 | -0.04 | -0.23 | -0.30 |
| Size | 0.30 | 1 | 0.37 | -0.26 | 0.08 | -0.38 |
| Value | -0.02 | 0.37 | 1 | 0.17 | 0.64 | -0.25 |
| Profitability | -0.04 | -0.26 | 0.17 | 1 | 0.22 | -0.19 |
| Investment | -0.23 | 0.08 | 0.64 | 0.22 | 1 | 0.01 |
| Momentum | -0.30 | -0.38 | -0.25 | -0.19 | 0.01 | 1 |
Source: Kenneth R. French Data Library, data to August 2026. Own calculations based on unsmoothed monthly returns.
Over the ten years, Momentum moved against Size (-0.38), Value (-0.25) and Profitability (-0.19). Value and Investment, by contrast, moved largely together. Factors with low or negative correlation can partly offset each other in a portfolio. Such a combination does not guarantee excess returns, as the weak ten years show.
What the figures do not show
- Other markets: The series describe US equities. For Europe and other regions, the library maintains its own series, which can differ.
- Implementability: Long-short portfolios before trading costs and taxes are not an investable product.
- The future: Ten years is a short period for factor premia, and the full series since 1963 is no assurance either. Past returns are not a reliable guide to future ones.
Frequently asked questions about factor risk premia
What are factor risk premia?
A factor premium is the excess return that shares with a given characteristic have earned over shares with the opposite characteristic, for example cheaply valued shares over expensive ones (Value). The Kenneth R. French Data Library measures it as a long-short portfolio: one group is bought, the other sold short.
How have factor premia performed over the past ten years?
Weakly. From September 2016 to August 2026, Size, Value and Investment in the US equity market were negative on an annualised basis (-2.5, -1.0 and -1.0 percent), while Profitability and Momentum were narrowly positive (1.9 and 1.4 percent). The market returned 12.6 percent a year above the risk-free rate. From 1963 to 2016, all five premia were positive.
Does the French Data Library include a Quality factor?
Not under that name. The closest is the Profitability factor RMW, which compares companies with high operating profitability with those with low operating profitability. It does not measure other quality characteristics such as low debt or stable earnings.
Can the figures be applied to Swiss equities?
Not directly. The series describe the US equity market, before trading costs, and as long-short portfolios with short sales. For other regions, the French Data Library maintains its own series, whose values can differ.

This article is for general information purposes only and does not constitute investment, legal or tax advice, nor an offer to buy or sell financial instruments. Everon AG is a wealth manager licensed by FINMA under FinIA. Past performance is not a reliable indicator of future returns.